DATA ANALYTICS & MACHINE LEARNING
Give Life — Predict Blood Donations
An end-to-end data analytics and machine learning project using the UCI Blood Transfusion Service Center dataset. Investigates historical donor patterns, examines data quality, and develops a balanced Logistic Regression model to estimate historical blood donation outcomes.
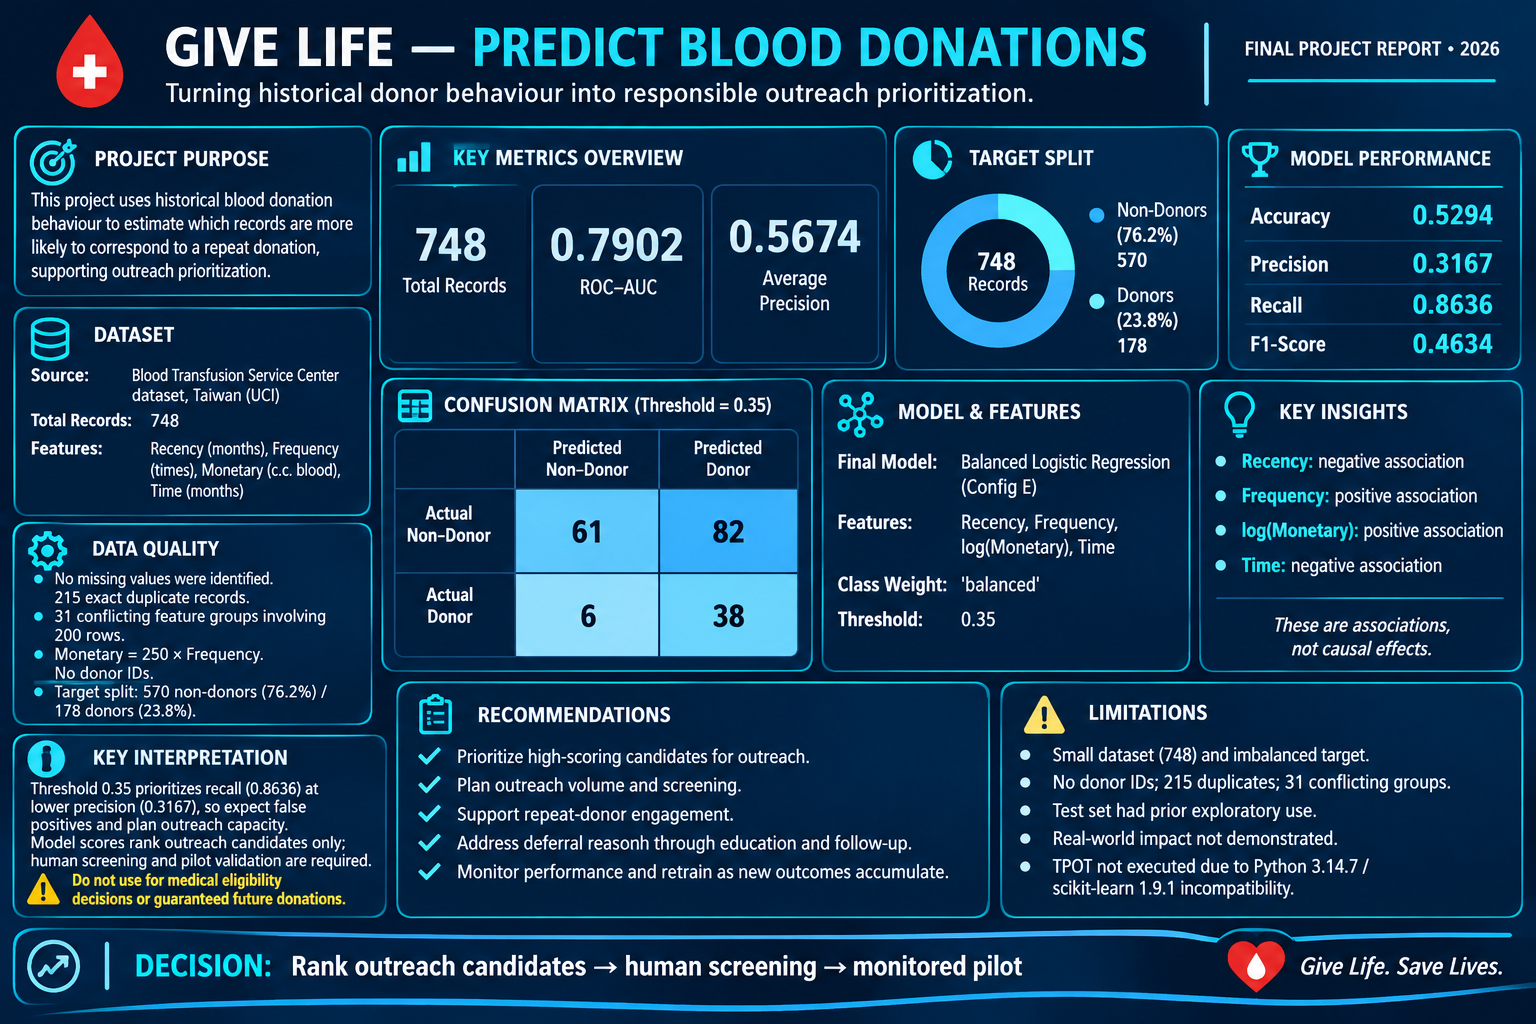
Project Overview
Give Life — Predict Blood Donations investigates historical blood donation patterns and develops a classification model to estimate whether a donor made a blood donation in March 2007.
The project uses the Blood Transfusion Service Center dataset from the UCI Machine Learning Repository.
It combines exploratory data analysis, data quality investigation, feature analysis, model development, evaluation, and business interpretation.
The objective is to demonstrate how historical data can support evidence-based decisions about donor outreach prioritization.
Tools & Technologies
Python
Pandas
Scikit-learn
Matplotlib
Jupyter Notebook
Dataset
UCI Blood Transfusion Service Center
Target
Donation in March 2007
Business Problem
Blood donation services need to maintain reliable blood supplies while encouraging regular donations.
The business question:
Can historical donor information help estimate which donors made a donation in March 2007, and how might these estimates support donor outreach prioritization?
Dataset
The analysis uses the Blood Transfusion Service Center dataset from the UCI Machine Learning Repository.
| Measure | Value |
|---|---|
| Observations | 748 |
| Columns | 5 |
| Non-donors | 570 (76.2%) |
| Donors | 178 (23.8%) |
Features:
- Recency: Months since the most recent donation.
- Frequency: Total recorded donations.
- Monetary: Total blood volume donated in cubic centimeters.
- Time: Months since the first donation.
- Target: Whether the donor donated in March 2007.
Source: UCI Machine Learning Repository — Blood Transfusion Service Center
Data Quality Investigation
Data quality was investigated before modelling because the dataset contains repeated records and no donor identifier.
| Measure | Result |
|---|---|
| Exact duplicate rows identified using pandas duplicated() | 215 |
| Rows involved in exact-duplicate groups | 275 |
| Unique exact rows | 533 |
| Rows involved in duplicate predictor profiles | 315 |
| Conflicting feature groups | 31 |
| Rows involved in conflicting groups | 200 |
The 215 exact duplicate rows identified using pandas duplicated() exclude the first occurrence in each duplicate group. This is why 275 rows are involved in exact-duplicate groups while 533 unique exact rows remain.
The dataset contains no donor identifier, so it cannot establish whether identical predictor profiles represent repeated records of the same donor or different donors. Duplicate records were retained rather than automatically removed.
Exploratory Analysis
The approximate target correlations were:
| Feature | Correlation |
|---|---|
| Recency | -0.280 |
| Frequency | +0.219 |
| Monetary | +0.219 |
| Time | -0.036 |
These are descriptive associations, not causal relationships.
Monetary and Frequency should not be interpreted as independent evidence because Monetary is mathematically determined by Frequency.
Modelling Approach
The project used binary classification to estimate whether a donor made a donation in March 2007.
Stratified Split
A stratified train-test split produced 561 training observations and 187 test observations, using random_state=42.
Cross-Validation
Model evaluation used 5-fold StratifiedKFold cross-validation with shuffling enabled and random_state=123.
Training-Only Selection
Training-only cross-validation and out-of-fold predictions were used for model selection and threshold selection.
Binary Classification
The target represents whether a donor made a blood donation in March 2007.
Final Model
The final model was Balanced Logistic Regression — Configuration E.
| Component | Configuration |
|---|---|
| Algorithm | Logistic Regression |
| Solver | liblinear |
| Class weighting | balanced |
| Random state | 42 |
| Features | Recency, Frequency, log(Monetary), Time |
| Monetary transformation | Logarithmic |
| StandardScaler | Not used |
| Selected threshold | 0.35 |
Configuration E achieved cross-validation Average Precision of approximately 0.5401, compared with approximately 0.5376 for Configuration D with balanced class weighting.
The difference was marginal and does not demonstrate a large or definitive improvement.
Model Evaluation
The following results are from the held-out test set:
| Predicted: No Donation | Predicted: Donation | |
|---|---|---|
| Actual: No Donation | 61 | 82 |
| Actual: Donation | 6 | 38 |
The model identified 38 of 44 actual positive cases, missed 6, and generated 82 false-positive predictions.
The high recall means the model captured most actual donors in the test set, but the lower precision means many predicted donations were false positives. The model is not highly accurate overall and does not guarantee future donors.
Business Insights and Recommendations
Recency
Recency was the strongest simple feature association.
Historical Frequency
Historical Frequency showed a positive association.
False-Positive Burden
High recall comes with a substantial false-positive follow-up burden.
Data Quality
Data quality and missing donor identifiers limit interpretation.
Proposed Applications
These are proposed applications, not demonstrated operational outcomes.
- Predictions could support exploratory outreach prioritization.
- Consider available outreach capacity and false-positive costs.
- Conduct a controlled real-world pilot before operational use.
- Improve donor identifiers and data collection.
- Maintain human oversight and all established medical screening procedures.
Limitations and Transparency
- The target is a historical March 2007 outcome, not a guaranteed future donation.
- The dataset is relatively small (748 observations).
- The target is imbalanced.
- Duplicate predictor profiles with conflicting targets exist.
- Donor identifiers are unavailable.
- Precision is relatively low despite high recall.
- The test set was used in earlier exploratory work and was not historically untouched throughout the entire project. Later model and threshold selection used training-only cross-validation and out-of-fold evaluation.
- No real-world pilot has demonstrated increased donations, reduced costs, or improved operations.
- The model does not assess medical eligibility or health status.
Conclusion
The project demonstrates an end-to-end analytical process combining data quality investigation, exploratory analysis, machine learning, model evaluation, interpretation, and business-oriented recommendations.
The final balanced Logistic Regression model achieved ROC-AUC 0.7902, Average Precision 0.5674, and recall 86.36% on the held-out test set at threshold 0.35.
Model results must be interpreted alongside data quality, operational capacity, and evidence limitations.