POWER BI • HOSPITALITY ANALYTICS • REVENUE MANAGEMENT
Hotel Performance Analytics
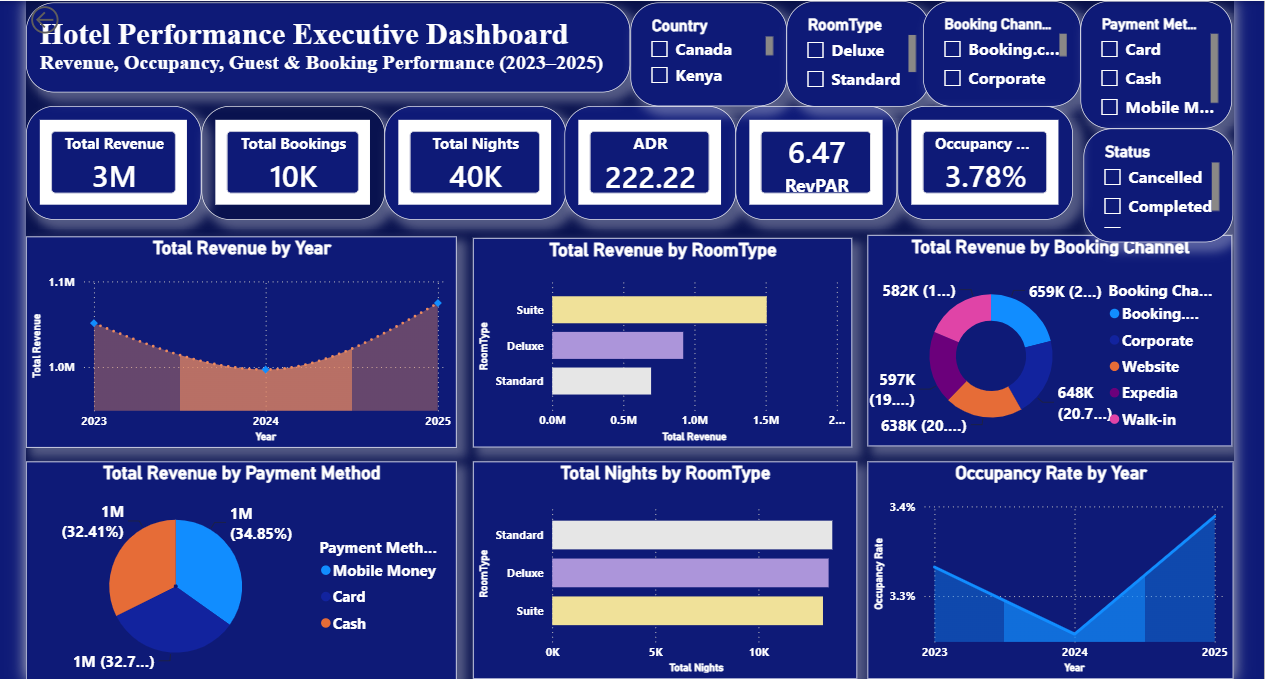
An interactive Power BI dashboard designed to analyze hotel revenue, bookings, room performance, occupancy, guest booking behavior and revenue management indicators across 2023–2025.
Project Overview
This project applies business intelligence and hospitality analytics to examine hotel performance across revenue, bookings, room types, booking channels, payment methods and occupancy.
The dashboard brings these indicators together in an interactive executive view, allowing hotel performance to be explored across different dimensions and periods.
Tools & Technologies
Power BI
DAX
Power Query
Microsoft Excel
Analysis Period
2023–2025
Business Objective
The objective was to create a management-oriented dashboard that makes hotel performance easier to monitor and analyze.
The analysis focuses on revenue generation, booking activity, room utilization and key hospitality performance indicators that can support revenue management and operational decision-making.
Key Performance Indicators
Total Revenue
Tracks the overall revenue generated within the analyzed dataset.
Total Bookings
Measures booking volume and provides an overview of booking activity.
Total Nights
Measures the total number of room nights represented in the analysis.
ADR
Average Daily Rate provides an indication of the average revenue generated per occupied room.
RevPAR
Revenue per Available Room provides a broader view of room revenue performance.
Occupancy Rate
Tracks the proportion of available room capacity represented by occupied rooms.
Analysis Areas
Revenue by Year
Examines how total hotel revenue changes across the 2023–2025 period.
Revenue by Room Type
Compares revenue contribution across Suite, Deluxe and Standard room categories.
Booking Channel
Examines how revenue is distributed across different booking channels.
Payment Method
Analyzes revenue according to the payment methods represented in the dataset.
Room Nights
Compares total nights associated with different room types.
Occupancy Trend
Tracks occupancy performance across the analyzed years.
Interactive Dashboard
The dashboard includes interactive filters for country, room type, booking channel, payment method and booking status.
These controls allow users to move from an overall executive view to more specific segments of the hotel performance data.
Business Value
The dashboard provides a centralized view of hotel performance and makes important revenue and operational indicators easier to monitor.
By combining revenue, booking, room-night, ADR, RevPAR and occupancy analysis, the report can support management in identifying performance patterns and evaluating different aspects of hotel operations.