DATA ANALYTICS • BUSINESS INTELLIGENCE
Retail Sales Analytics
An executive dashboard delivering end-to-end retail sales analysis using SQL Server, Python, Excel and Power BI, covering revenue performance, customer segmentation, product returns and market trends.
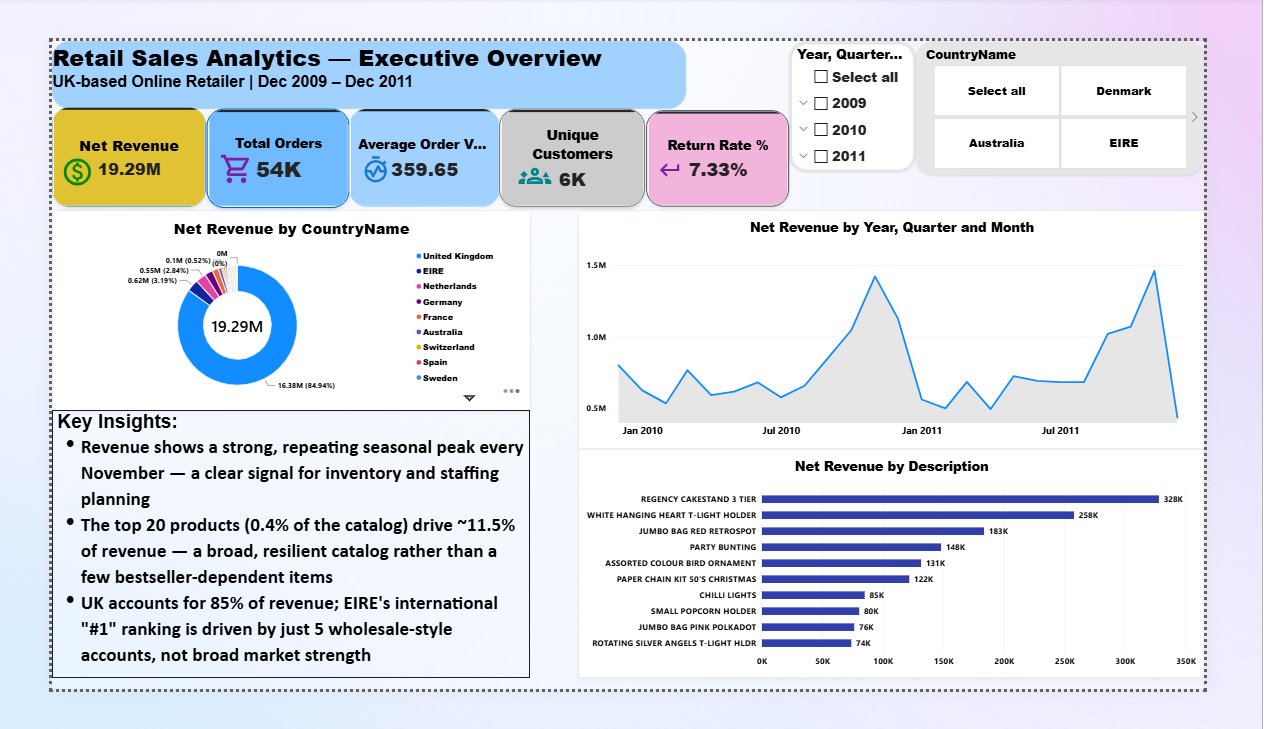
Project Overview
This project takes a large raw retail transaction dataset through data processing, SQL analysis, Excel validation and Power BI dashboard development.
The dashboard brings revenue performance, customer segmentation, product returns and market trends together in an interactive executive view, supported by a validated source of truth in SQL Server.
Tools & Technologies
SQL Server
Python
Excel / Power Query
Power BI
Verified Revenue
£19,287,250.55
Business Objective
The objective was to move from a large raw transaction dataset to a reliable, validated revenue position and an executive dashboard that makes retail performance easier to monitor and analyze.
The analysis focuses on revenue performance, customer segmentation, product returns and market trends, with a strong emphasis on data validation and cross-checking across independent tools.
Data Validation: Recovering £1.5M
During analysis, a data validation issue was uncovered. One apparently high-performing product had only a single completed order, so the outlier was investigated further.
The investigation revealed an 80,995-unit wholesale order that had been fully cancelled, but the cancellation had not been correctly accounted for in the revenue logic. This caused revenue to be overstated by approximately £1.5M.
The logic was traced and corrected, and the corrected result was independently re-verified using SQL Server, Excel and Power BI. All three matched to the penny at £19,287,250.55.
Key Findings
Recurring November Peak
Revenue shows a recurring November peak, providing a useful signal for inventory and staffing planning.
Customer Concentration
Champions represent approximately 22% of customers but generate about 68% of revenue.
Wholesale-Driven Market
One apparently strong international market was heavily influenced by a small number of wholesale accounts rather than broad customer demand.
Elevated Return Rates
Certain novelty and decorative products showed return rates substantially above the business average.
Analysis Overview
SQL Server
Database design, ETL and transactional-level analysis of the raw retail dataset.
Python
Data processing and ETL steps supporting the analytical pipeline.
Excel / Power Query
Independent validation and cross-checking of the corrected revenue result.
Power BI
Data modeling, DAX calculations and interactive executive dashboard development.
Business Value
The project demonstrates how a disciplined validation workflow protects the business from acting on incorrect numbers — in this case preventing £1.5M of overstated revenue from reaching decision-making.
With a verified revenue position of £19,287,250.55 matched to the penny across SQL Server, Excel and Power BI, the dashboard provides a reliable foundation for inventory, staffing and market planning.